
A digital marketing agency, design/branding studio, UX consultancy, web development firm and any other creative services business are all similar in that they are asset-light, people-intensive businesses that rely on successful delivery of work for clients.
What constitutes a successful delivery? Client satisfaction, team satisfaction, and profits.
I want to focus on the profits part in this piece and explore some examples of what a profitable engagement looks like and why the two biggest levers in this business are your ability to control costs and your ability to price.
The Model
I’ve built a Google Sheets model to demonstrate how an agency can calculate profitability for a given project. Every agency will have its own twist to how they calculate their internal hourly rates, their desired pricing, and freelancer costs. This is just one perspective, and like any example, you may or may not find it helpful but it probably won’t hurt to mess around with it.
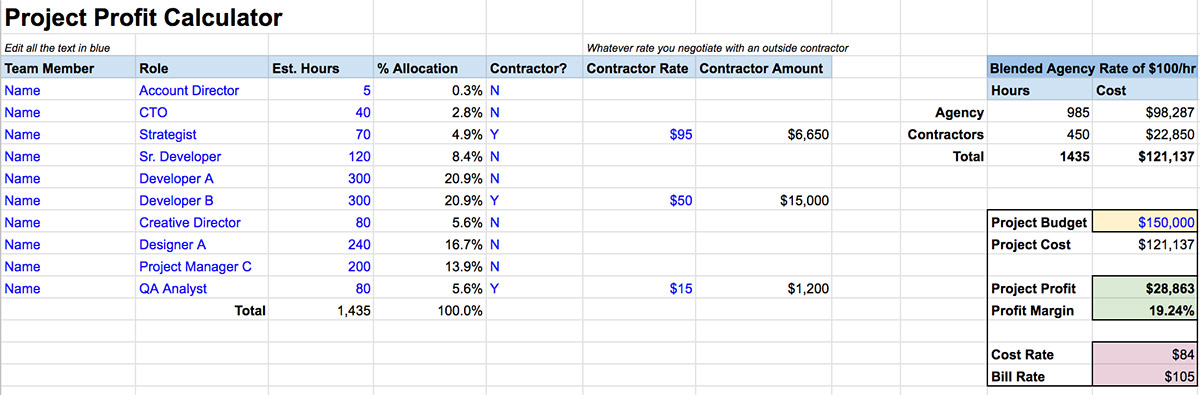
A screenshot from the Project Profit Calculator model in Google Sheets.
In this model, I’ve constructed a fictional 29-person team that costs a little over $3.6 million to run for 1 year. Under the “Team Rate Calcs” tab, I’ve put in the parameters for calculating this. It’s a rough number that assumes a 10% overhead on top of salary with 35 billable hours per week and 48 billable weeks per year per person. With the different roles ranging from a Principal who takes a $350k salary to the $36k intern, the “blended rate” for the agency comes out to around $100/hour. This is not the rate that is shown to clients, but an internal rate that assumes all work needs to clear this $100/hour hurdle in order to break even and cover the costs.
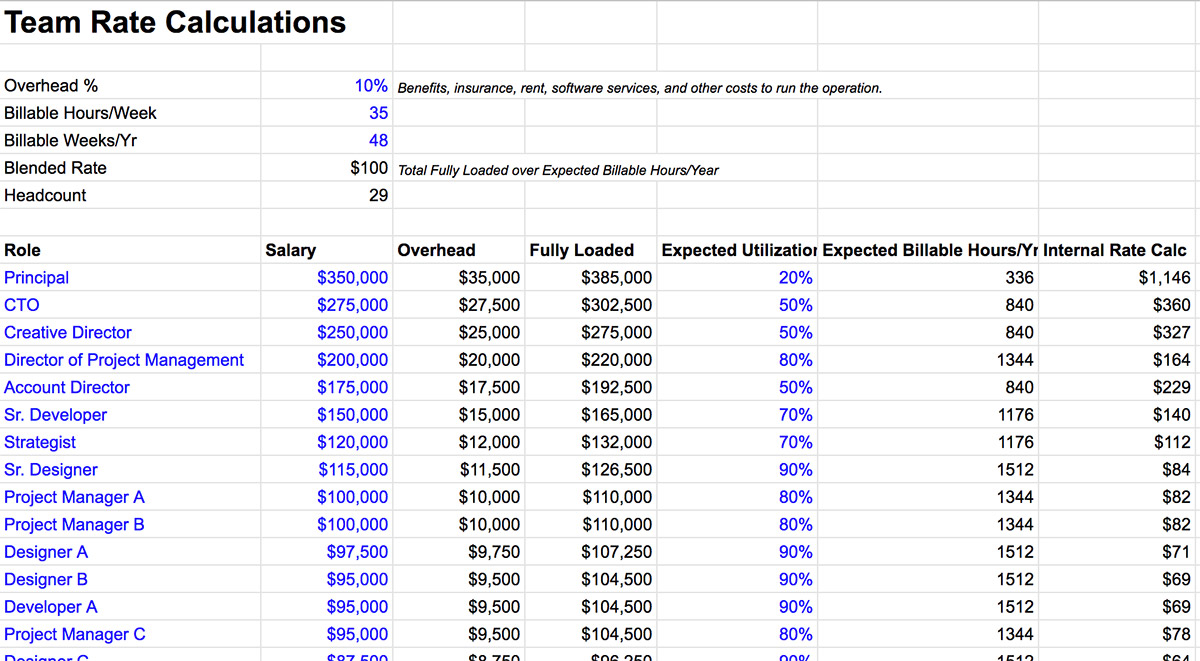
The Team Rate Calcs tab is used to generate a blended rate. All data in here is fictional.
If you decide to make a copy of this model, you can reconstruct the team and put in your own assumptions and roles to land at a blended hourly rate. One thing you’ll notice is that the more lower level talent that you have, the lower the blended hourly rate will go down. This is the traditional pyramid structure of services businesses in action – the higher-paid folks on top are supported by a large base of lower-paid labor below. It only works as long as the volume of work supports it, so it’s important to make sure the structure of your team can properly support the type of work you’re able to land.
Under the “Project Template” tab is where you can run different project scenarios based on who is staffed on the project, what their projected hours will be for the effort, and if any of these roles will be handled by an outside contractor/freelancer.
The main inputs on this sheet are:
- The Team: who is working on this and what is their internal role rate?
- Estimated Hours: this is typically figured out with the team as each person doing the work should be able to weigh in on their estimated contribution; the ability to estimate accurately and follow through on the number is crucial to profitability as any overruns in hours will erode profitability
- Contractor Usage: can contractors be leveraged to bring down the hourly cost of a certain role? This only makes sense if there is enough work that everyone on the team is already fully utilized and the contractor is being used to extend the team. If someone is sitting idle on the team, then they should be used before any contractor is brought in since an underutilized team member will sink profits
- Project Budget: what are we charging the client? The ability to command a high price will often make up for whatever shortcomings you may have in delivery inefficiencies and high labor costs. The ability to price high often depends on the types of clients you’re able to attract and the degree to which the client values your services (which is a function of your differentiation/positioning/expertise). I highly recommend Win Without Pitching sales coaching for this. Also check out my blog post on the book Pricing Creativity, which is used as the basis of the Win Without Pitching approach.
I left some high-level rule of thumb pointers on the sheet as well. They are:
- 140-160 hours will get you someone working full-time on a single project for an entire month
- Hours estimates should include things like internal and client-facing meetings
- (As previously mentioned) Going over on these hours, especially for internal team, eats very quickly into profit
- Getting contractors on a fixed fee project basis can often prevent budget overruns / pushes risk to contractor
- Should have a benchmark for Profit Margin and try to beat it; 35-40% is a good start
- (As previously mentioned) Don’t use a contractor unless the internal team is 100% utilized for the needed role
One area that I don’t get into is project duration. This is an important factor but one that I’ll explore another time. The reality is, you can be spot on with your estimates and get things done efficiently, but if a project drags on while keeping team members from moving on to other projects, this can be a disastrous scenario. This is why sticking to project schedules or exercising some kind of pause clause is paramount. You can also try to overload team members by staffing them up on multiple projects with the belief that at least one of the projects will drag on, but that runs the risk of resourcing confusion, burnout, and team turnover.
To get a better handle on this model, let’s explore a few different scenarios using the same team. The Google Sheet includes tabs for each of these scenarios if you want to scrutinize them more closely or modify them.
Scenario 1: Website Design & Development Project
The agency assembles a 7-person team to tackle an eCommerce website project for a small but growing fashion company. The team is actually more like a 5-person team since the Account Director is really present only at the start to ensure a proper kickoff and the QA Analyst comes in for a week of testing and bug ticketing when web development is in a good place.
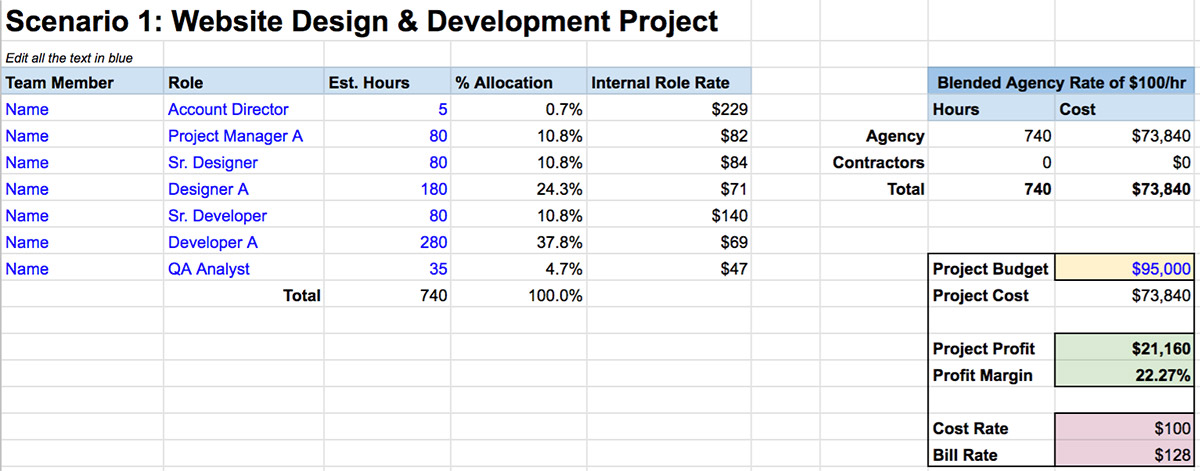
Scenario 1 explores a website design & development project with a $95,000 budget.
The team spends some upfront time talking through the project approach, all the templates and features that will need to be designed and built, and all the other components and details they’ll need to consider. After much deliberation and estimation, they’re able to come up with buckets of hours for each of the team members.
For this project, the team will be using only full-time W2 employees and no outside contractors.
At the blended rate of close to $100/hr, the project cost comes out to $73,840.
The agency is able to charge $95,000 for the project, which would be an effective bill rate of $128/hr for 740 hours worth of work. The agency was hoping to charge $110,000 for it, which would’ve been a $150/hr bill rate, but the client balked and negotiated on price.
If the blended rate calculation is accurate and project duration wasn’t an issue, this project would have contributed $21,160 of profit to the company. This also assumes that the members on this project are sticking to their utilization targets. If any of these factors are off, the $21k on paper will likely be much lower.
Is this result good or bad? It really depends on the agency’s expectations for profits, what kind of efficiency they’re striving for, and if how they feel about pricing (did the client pay sufficiently for the value delivered?).
I’ve seen projects have very high profit margins on some engagements and razor thin ones on others. What you want to avoid at all costs is having projects that lose money, a painful lesson I’ve had to learn from one too many times.
Scenario 2: Marketing Campaign
The agency lands a $55,000 engagement to run a large paid marketing campaign for a period of 4 weeks. It’s a short-term project with a clear end date.
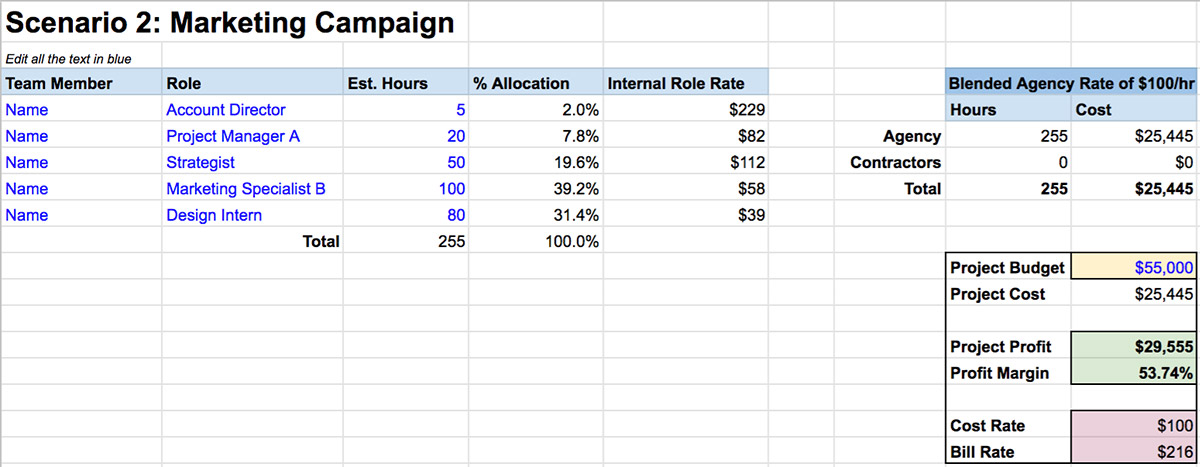
Scenario 2 explores a Marketing Campaign with a $55k budget that nets a healthy profit.
Most of the work is handled by the Strategist and Marketing Specialist as they run ads on various social channels. They also get support from a Design Intern to prep assets for the ads.
Using the $100/hr blended rate, the cost for this project ends up being $25,445. The media budget for this is $750k, so the client feels like they’re getting a good deal paying $55k for an agency to run it. The agency books almost 54% in profits or $29,555. As you can see, the bill rate for this project ends up being a nice $216/hr if the team sticks to their estimates.
These short-term engagements with a definitive end date and clear scope are often the most profitable. In my experience, these types of engagements have happened infrequently and often come at the last minute with fairly impossible deadlines, which means, if you really want to take it on, you’ll need to shift resources and put the team through some stressful times. The money is nice but sometimes the strain a request like this puts on the team isn’t worth it. It helps if you have a network of trusted contractors to spin up in such cases.
Scenario 3: Branding Project with a Freelance Designer + Illustrator
The agency sells a branding project to a direct-to-consumer eCommerce startup for $100,000. This includes brand strategy, logo design, packaging, style guide, and a series of illustrations.
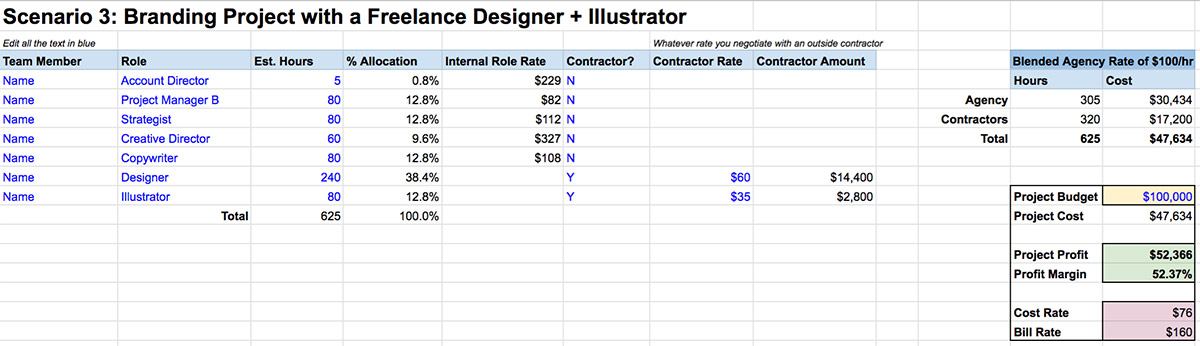
Scenario 3 features a branding project where the agency uses an outside freelance designer and illustrator to get the project done.
The Creative Director suggests they use a freelance designer who has deep experience working on DTC eCommerce brands. It works out because the team’s full-time designers are fully staffed on other projects anyway. The CD also has his eyes on an illustrator in Spain who has a distinct style that would make sense for this project.
The Project Manager is able to work with the Designer and Illustrator to align on a scope of 240 hours and 80 hours, respectively and gets them to sign a fixed fee contract with up to 3 rounds of revisions built in. So while the contractors used hours to estimate the work and arrive at a fee, they’ve agreed to deliver work for the agreed upon amounts. For the Designer, the fixed fee for about 8-10 weeks of work (including some waiting time for feedback and meetings) is $14,400 based on a $60/hr rate. For the Illustrator, it’s $2,800 for about 2 weeks of work based on a $35/hour rate.
With the other roles accounted for–the Strategist and Copywriter for the research and brand strategy deck work and the PM making sure things are moving forward–the cost of the internal agency team comes out to $30,434 at the roughly $100/hr blended rate.
When you take these together, the cost rate overall becomes $76 and the total cost is $47,634. The project profit ends up being 52% or $52,366, much more lucrative than the website project in Scenario 1.
Scenario 4: Website Add-on with Contractors
A few months after the launch of the website built in Scenario 1, the client asks the agency to help them with an addition of a new section. The full-time team is mostly fully staffed on other projects, so the agency needs to lean heavily on their network of contractors to get it done.
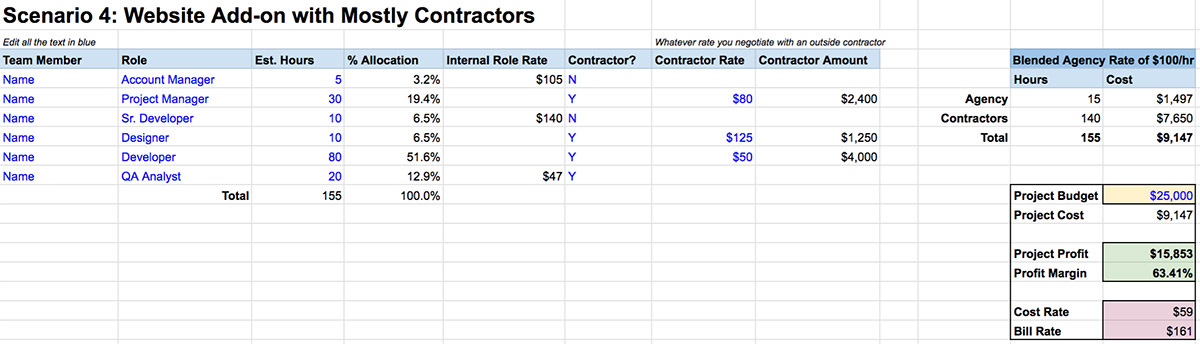
Scenario 4 explores a website add-on project using mostly contractors. It imagines the work being on the website built in Scenario 1.
Four contractors–a Project Manager, a Designer, a Developer, and a QA Analyst–are briefed on the project and have all agreed to fixed fees based on estimated hours. From the agency side, the Account Manager helps to on-board and check in on things while the Senior Developer who originally worked on the website is staffed for up to 10 hours to assist the contract Developer if there are any questions.
The cost rate for this project is $63/hour for a total of $9,747. The client agrees to a fee of $25,000, more than 25% of what they paid for the entire site in Scenario 1. Because the website has been generating revenue since launch and been well-received, the client is more liberal in investing further amounts to improve and expand the website. This breaks down to a $161/hr bill rate that should be easy to hit since the people doing the work have signed fixed fee contracts.
The profit on this project is $15,253 or a 61% profit margin. Compare this to the $21,160 made on the initial full website design and build. What’s the takeaway?
One could argue that the agency should have charged more in Scenario 1. But then again, one could also argue that the lower profits in Scenario 1 enabled greater profits in Scenario 2. Also, if the agency didn’t have a robust contractor network and had to squeeze this work with the internal team, the profit margins at $100/hr cost rate would have mean lower profits (sub 40%, still pretty good).
All this is to say that there are many decisions to make when it comes to doing customized client work in this business and there are no right or wrong answers. You can try your best to optimize, experiment, and learn. And of course, do your best to never lose money at all costs.
[Bonus] Scenario 5: Experienced Talent vs. Junior Talent
In this last scenario, I wanted to have a little bit of fun and explore what might happen on a $300,000 website redesign project that was staffed 100% with internal team members. In one imagining, the team would be staffed with the most experienced members, the A-team if you will. In the other scenario, the team would be staffed with more junior talent.
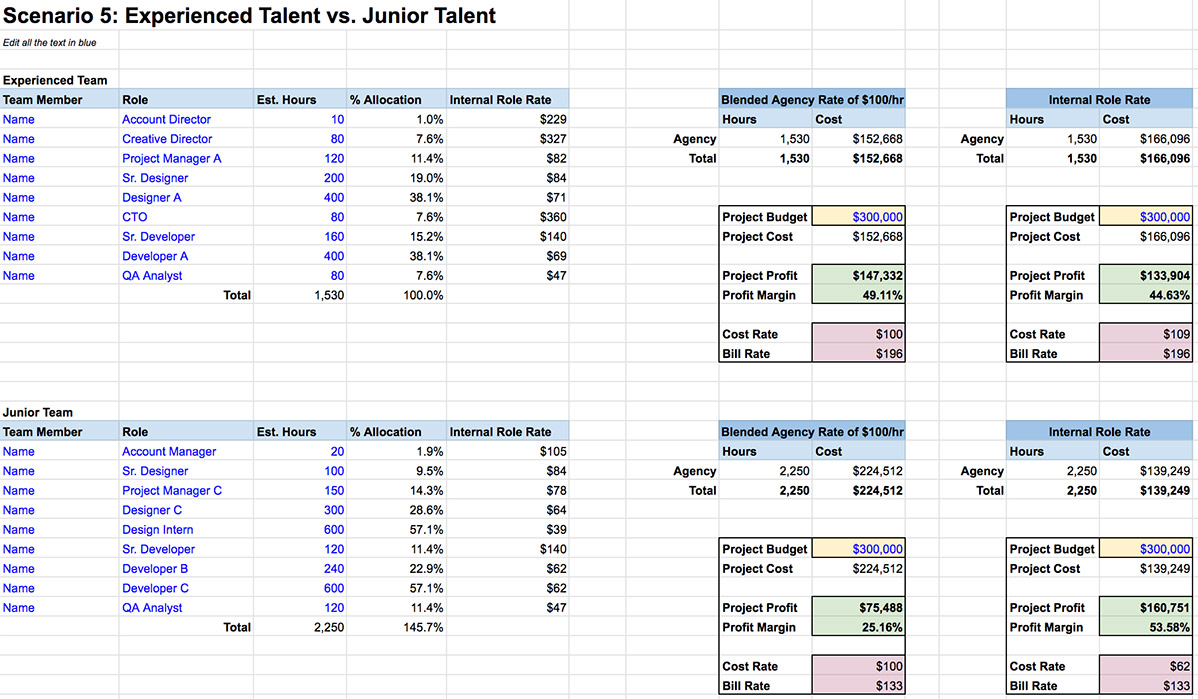
In Scenario 5, an exploration of project profitability if a $300k website was made by an experienced team vs. a more junior team.
For this comparison, I’ve made some assumptions on the performance of these two teams. I’ve assumed that it would take nearly 50% more hours for the less experienced team to get the same project done. Even then, it’s uncertain whether or not their work would be of equal quality, but having seen such scenarios firsthand, a more senior team usually gets it done faster and better.
When you compare the two teams’ profit performance using the agency blended hourly rate of $100/hour, the difference is huge. The experienced team can book more than $70k in profits and in less time ($147k vs. $75k). The bill rate for the experienced team doing the $300k project comes out to $196/hour vs. $133/hour for the junior team.
But here’s the thing: staffing a senior team to do projects is hard. When agencies scale, the people who are most experienced and skilled often get promoted to becoming managers and are less and less available for projects. The hope is that with an experienced manager, they can field a talented team with high output and great quality. This is very much a possibility, but along the way, teams will most likely experience some sort of over-reliance on junior talent due to resourcing challenges, turnover, or payroll constraints. One way to mitigate this is to continue to develop a network of contractors that include experienced pros ready to step in and provide their expertise when needed.
Going back to our scenario model, I created a column to show profit based on the Internal Role Rate. By calculating project profit based on per-person cost, we see that the junior team actually ends up booking almost $27k more in profit ($161k vs. $134k).
This is the challenge of using a blended hourly rate for profit calculations – it can make a junior team seem much more expensive and it can make a more senior team seem less costly. However, the assumption is that over the course of a year, the billable hours per role maps to what was estimated in the Team Rate Calcs tab and the mix of projects reflects the limited availability of senior talent vs. the higher billable hours for junior talent.
Takeaways
There are more accurate and automated ways to track profits at an agency. Some firms use professional automation systems (PSAs) or jerry-rig accounting + time-tracking software to keep tabs on project profitability. The important thing, I’ve learned, is to make project profit calculations a routine part of the business, even if it’s using a simple spreadsheet. Rather than a once-in-a-while check to see if a past project was profitable, this is something worth reviewing at least once a week if not more for upcoming, active, and just-completed projects.
When you set clear expectations for how much profit a project should bring in, it’s easier to then track project progress and see if the team is on track. I also feel that it’s worthwhile to get the entire agency on-board with the topic of profitability and why/how it matters to the company. This requires training, repetition, and the roll-out of processes to help profit-based thinking become commonplace.
As a final note, I don’t pretend to have this all figured out. It’s a continual series of experiments to try new approaches to improving the way we operate our agency business at Barrel. I can confidently report that spending serious time in these types of calculations have been beneficial to the business. Hopefully you’ll find some useful bits in here, and I’d love to get any feedback or your own pointers.
Brilliant and thanks. I worked at Saatchi in the good old days and, while we did track profitability, it was not totally baked into our process as virtually every 15% commission account made decent bucks. I had a great CFO when I ran my own agency and we accounted for every buck – she loved spreadsheets. Often this resulted in my asking my creative directors not to tweak work into oblivion. I now council agencies. Too many have no clue what is really going on. Many just cry a lot.
This is a brilliant breakdown and I thank you wholeheartedly. The spreadsheet is incredible!
This is a great worksheet, and will be really helpful. This will be a great way to pinpoint how productive your clients are being. Clients combining these worksheets With Timebank GPS will definitely boost a client’s business.