
I’ve created a spreadsheet that agencies can use to plan their finances for an upcoming year using a bottoms-up approach. With the right inputs, one should be able to come away with targets for revenue and profit.
For the past ten weeks, my Barrel co-founder Sei-Wook and I have been poring over our finances, reorganizing the data, and coming up with different ways to land at our targets for next year. It’s been an enlightening exercise, and the real benefit has been that we feel more confident in having a grasp of our numbers than ever. We’ve become a team that’s become disciplined about time-tracking data and hitting utilization targets. We’ve also been keen on hitting certain profit margins on all projects while ensuring we don’t have any blow-up situations. Having these systems in place has allowed us to come up with assumptions that then plug into our forecasts and targets for next year.
I won’t go into too much detail about the nitty gritty of the spreadsheet itself. Instead, I’ll share the high-level thinking behind the major components of the tool and why I think it’s helpful to run this exercise. Also, all numbers shown in the spreadsheet and in these screenshots below are completely made up.
Click here to make a copy of the spreadsheet for yourself.
Starting with the Core Team
We started our exercise by getting a clear picture of our cost structure going into a new year. We tallied all of our billable full-time salaried employees and we also identified contractors and freelancers whose costs were tied to long-term projects and retainers with predictability.
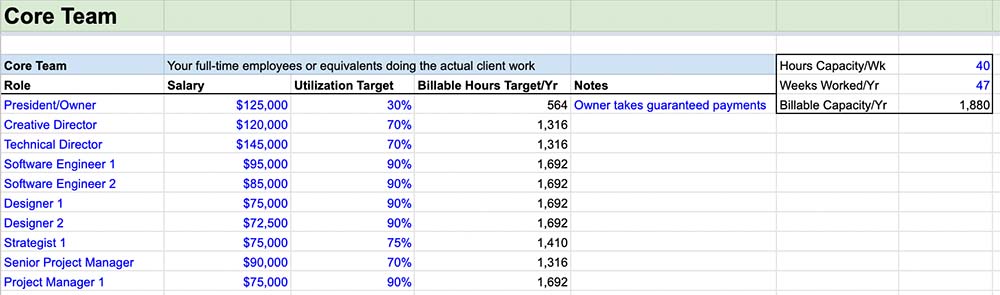
The Core Team tab is at the heart of this tool as it builds on the blocks of resource cost, billable capacity, and utilization targets.
For the full-time salaried employees, we came up with their billable capacity based on utilization targets for their role. For example, a designer might be expected to be 90% utilized, meaning that if we had a 40-hour work week, they would be expected to log 36 billable hours (provided we had that work for them to do). A director-level employee might have a lower utilization target because they have more non-billable responsibilities such as managing employees, recruiting, and taking part in sales.
Mapping all the utilization targets and billable capacity helped us to see our team’s total capacity for the year. While it’s highly likely that targets won’t always be met or headcount numbers will change, getting to a baseline number is helpful. In the spreadsheet example, a 10-person team, after factoring in different utilization targets for different roles, had 14,382 hours available for the year.
Adding Up the Costs
Core Team
Having a sense of our Core Team gave us the full picture of our full-time equivalent cost, which is reflected in the Costs tab. For full-time salaried employees, we had to factor in overhead costs like insurance and benefits as well (typically 15-20% from our experience). In the spreadsheet, I applied an overhead to everyone coming over from the Core Team tab, but you can modify that if this isn’t the case for your team.
Contractors/Freelancers
It’s also important to consider contractor/freelancer costs as they happen throughout the year, but many one-off contracts with them are hard to predict, so if anything, we would only include those who are attached to signed (or almost signed) projects and retainers.
Sales, General, and Admin (SG&A)
We spent time going line-by-line over all of our expenses to get a sense of what costs would reappear in the new year and what costs were simply one-offs. Unsurprisingly, software subscriptions were one of the biggest items for us and within that were dozens and dozens of tools that needed to be canceled, scaled down, or switched to annual plans. Even with some buffering across categories, we’re fairly certain than we can bring down sales, general, and admin (SG&A) costs down next year.
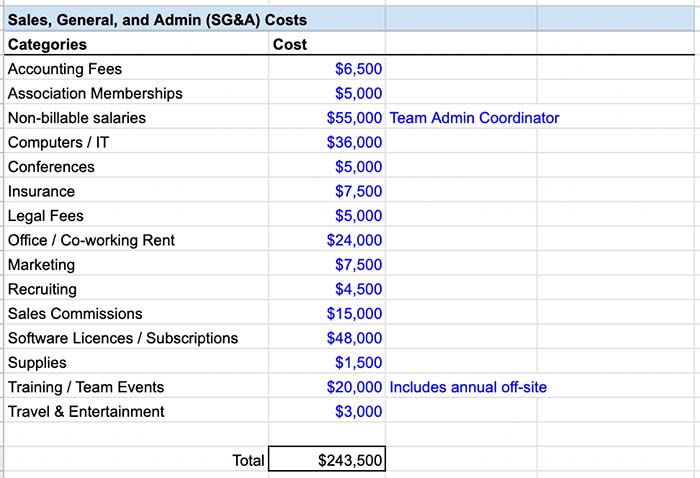
Going through all the categories of your SG&A costs can help you see where the majority of your expenses are and inspire ways to save.
In the spreadsheet, I included a list of common categories for expenses. We use some more detailed ones at Barrel, but I thought these 15 were a good start. A good target for SG&A really depends on the size of your org and what you feel is important to spend on. For us, we’re aiming for around 12% next year, which would be an improvement on 2022.
All of these costs are added up in the Overview tab as “Starting Cost” to give you a sense of what you need to make in order to get to profitability.
Mapping Out Revenue
We’ve always jokingly lamented over the years how a new year meant starting at zero and, returning from the holidays, setting out on another 12-month slog. The truth is that the starting place is not quite zero, but in our experience, it’s also less than what we’d ideally like.
Over the past couple of months, we’ve been in talks with all of our existing clients on plans for next year. Some were quick to give us the green light to renew an ongoing retainer for the new year while others asked for more time to make their decision. We also have a handful of projects that started this year that will continue on through the early part of the new year. Adding these up, we got to about 45% toward breakeven, which means we still have more than halfway to go before seeing our first dollar of profit.
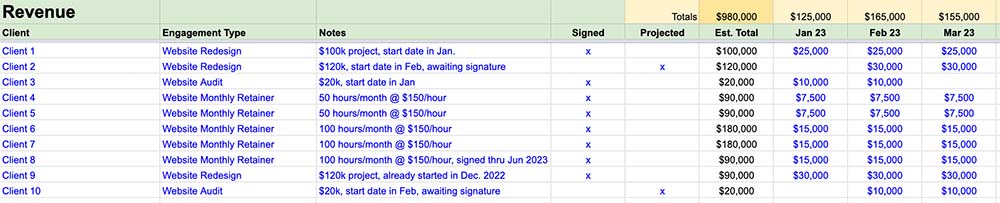
Getting a handle on signed and expected work for the new year can help you have a better sense of your starting revenue and how far off you are from breakeven and profitability.
We then put in “likely” projects and retainers that are in contract talks, basically just ironing out a few details and getting a signature (hard to do during December). In the spreadsheet, this is reflected as “projected” engagements that you can check off. With the “likely/projected” engagements added, we were about 85% of the way towards breakeven, which felt better. But keep in mind that getting to breakeven at 100%, in the way I’m talking about it here, is just the amount that covers the labor and SG&A costs. We’ll have to go way beyond that to have taxable profits.
I like the exercise of continually revisiting revenue projections and forecasts. In addition to layering in the more certain projects in the contract stages, we’ll play around with adding in some opportunities from the pipeline to see how that impacts things. We’ll always lean on the side of being extra conservative with pipeline figures, but it’s also good to see how a handful of decently sized projects can really tilt the business towards better outcomes. We use HubSpot to automatically get our pipeline figures daily, but I like to see the line-by-line manual calculations on a spreadsheet because it helps me to get a better feel of how new wins can impact profit margins, cash flow, and utilization (I think tools like Parallax or Kantata, f.k.a. Mavenlink might do this automatically and we’ll eventually get on a platform, but for now at our size, we don’t find it onerous to track things on a spreadsheet).
In the spreadsheet, once you put in the signed and projected engagements, you’ll get a Starting Revenue figure.
Overview: Putting It All Together
Once you’ve put in Core Team information (primarily utilization figures), Costs, and Revenue, you can quickly calculate the gaps needed to get to breakeven and then towards profitability.
The Overview tab has a couple different ways of looking at setting revenue and profit targets for next year. The primary approach that we’ve been building up to is a bottoms-up one where we take the Core Team’s overall billable capacity for the year, and assuming we max out their utilization targets that have been defined for each role, multiple this number by a blended billable rate to get to a revenue figure.
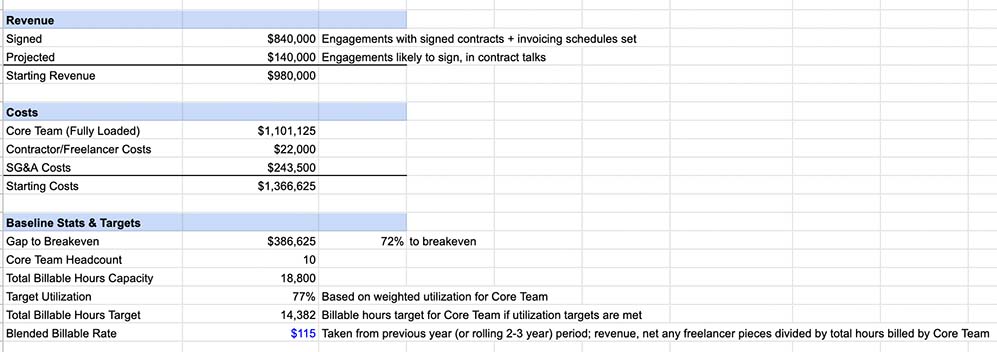
The Overview tab ties together the inputs and starts to work towards the targets for revenue and profit.
The blended billable rate is taken by looking at your team’s historical data. For Barrel, we leveraged our Harvest time-tracking data to look at the past 12 months to get the number of billable hours logged. We then divided our trailing twelve months revenue by this number to get the blended billable rate. Here’s an example to demonstrate this more clearly:
- Your team had revenue of $2,000,000 in the last 12 months
- Looking at your time-tracking data, your team logged 15,155 hours (at a 77% utilization)
- $2 million divided by 15,155 = $132/hour
- Your blended billable rate is $132/hour
Key thing to note here is that this number is not the same as effective hourly rate, which would take into account the total capacity of the team. In this example, that would mean $2 million divided by 19,682 hours, which would equate to about $102/hour. In this model, I’m assuming that whoever uses this tool has access to time-tracking data and can easily calculate utilization and the blended billable rate. In theory, if your team is 100% utilized, then the effective hourly rate would be the same as the blended billable rate, but oftentimes, because not all team members are doing billable work 100% of the time, the billable rate has to be higher to make up for the difference.
Once you’ve got the blended billable rate, you can play around with the different Scenarios and toggle utilization and billable rates to see what revenue and profit you get if things go well and if things don’t. From experience, we’re extremely cautious about monitoring our utilization rates every week and for the upcoming weeks. If we see a trend towards underutilization dipping below our target by more than 5 percentage points, we know we need to either win new work fast or start thinking about a reduction in force. Failure to act is one of the quickest ways to wipe out whatever profit you might’ve accrued to date.
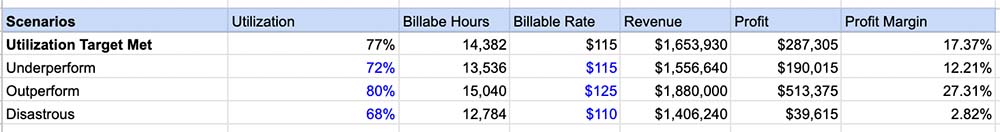
Once you have all the inputs in, you can play around with different scenarios using utilization and billable rate as levers.
Below the Scenarios section is the Revenue Gap where, based on the selected scenario, you can see how much new work needs to be signed and completed in the new year in order to get to the profit level calculated in the scenario. This is then broken down to show the number of billable hours that need to be sold at the billable rate in order to close the gap.
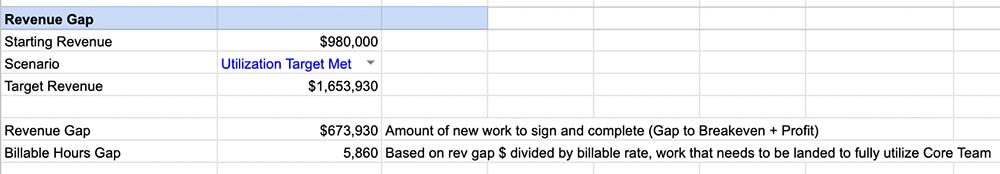
The Revenue Gap shows how much new business you’ll need to land and complete in order to hit target profitability.
The thing to remember for this model is that it assumes the scenarios with the Core Team not changing at all. That is, the scenarios are all about maximizing revenue and profit with the existing team and no growth. However, you can work around this by adding potential Core Team additions into the model and estimating their salaries (if you’re planning on hiring mid-year, for example, be sure to account for only 50% of their annual salary figure).
In the last section, I added a bonus Growth Goals Scenario as a more top-down way to calculate and compare revenue and profit targets. Here, you can start with the previous year (to the new one) revenue and then write down your desired year-over-year growth percentage. I noticed that after doing the exercise using the bottoms-up approach, my appetite for bigger percentages diminished greatly – seeing the gap clearly made me feel a lot more conservative about our prospects.
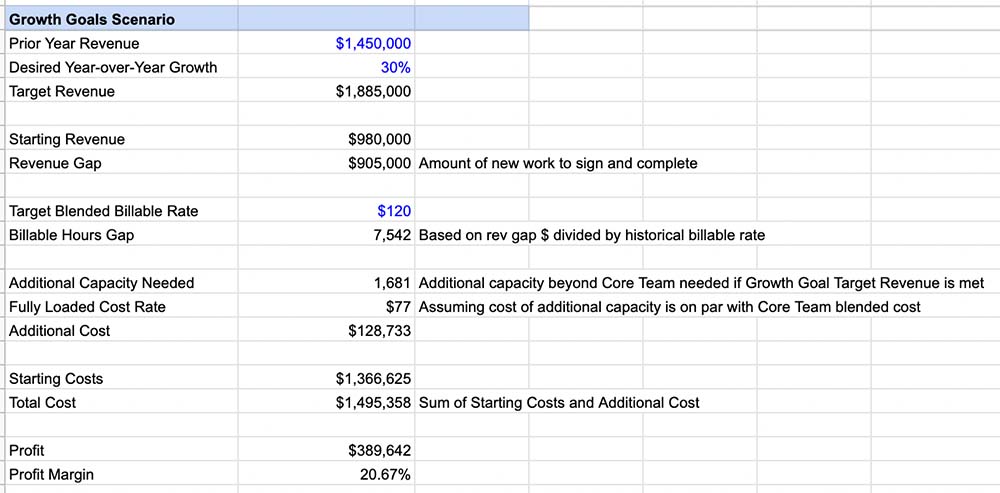
The Growth Goals Scenario takes a top-down approach based on your last year’s revenues and your projected year-over-year growth rate.
The Growth Goals Scenario still assumes you’ll be operating with your Core Team, so after it calculates the revenue gap by subtracting the Starting Revenue from the Target Revenue, it then calculates the additional hours you would need, if any, to service the extra work if you land them. It then takes a blended cost rate (fully loaded cost divided by total billable hours for Core Team) and multiplies by those additional hours to figure out additional cost that would be needed to service the work. The more aggressive your growth goals, the higher the additional costs will be to reflect all the hiring you’ll need to do.
Know Thy Numbers
For much of my career, I avoided looking much at our finances. I’d only jump in when things were looking bad (e.g. client churn, a string of new biz losses, a series of over-budget projects, etc.) and then usually to calculate the bare minimum we needed to keep the business afloat. The lack of discipline in establishing key metrics and holding ourselves accountable held us back for many years and caused all kinds of stress. It took some learning (reading lots of business books helped) and commitment from all of the Barrel partners to really change our attitude when it came to numbers.
These days, we balance the relationship, creative, and technical aspects of our business with the financial ones, and we make sure the money-related questions and topics are never glossed over. Project budget performance, employee utilization, freelancer rates, extraneous costs – we understand that all of these pieces factor into the overall financial health of the company, so best to pay attention to them and have systems in place to track and report on things every week.
It’s been a healthy development to then take our day-to-day finance practices and to build out a system for forward-looking projections. We’re using our revenue and profit targets in the new year to design new performance bonus programs and to invest in the development of new sales and marketing programs as well as new services offerings. Rather than pursuing an idea because it merely sounds good and logical, we’re working to be more disciplined about calculating investments in new initiatives, projecting the upside, and keeping ourselves accountable to the results, giving ourselves the clarity to pull the plug on misfires and to double down on winners.
I hope the spreadsheet tool, even in its rough form, is a helpful exercise for you. Please hit me up with any feedback and suggestions.
If you found this tool helpful, check out a couple other ones I made: